
FIFA 2026 World Cup: What Actually Happens Next
A live probability tracker that updates as the tournament does — and lets you argue with the model.

This is the product story — what the tracker does, why it exists, and how to use it.
The technical build story — how Claude constructed the model, the simulation engine, and what bracket resolution actually involves — is on Promptcraft: Building a Live FIFA 2026 World Cup Probability Engine with Claude.
In 2014, I was at Dell as part of their Global Analytics team. We were trying to encourage teams across the organisation to actually use predictive analytics in their work — not just know it existed, but reach for it when solving real problems.
The honest assessment at the time: it wasn’t taking off the way we hoped.
So I proposed an experiment. Instead of pushing it through work projects, why not make it fun? Run an internal prediction competition around the FIFA 2014 World Cup. Get people excited about a problem they already cared about, and let predictive analytics be the vehicle.
It worked. People engaged. It became a small catalyst for applied analytics within the org — which was exactly the point.
But here’s what that effort actually involved: teams pulling data manually from wherever they could find it. Models that took significant time and technical skill to build. Results that were hard to explain to anyone who hadn’t built them. A process that required real expertise, real effort, and a lot of trial and error — just to get something rough and functional.
That was 2014. Three World Cups ago. Ancient history, in technology terms.
Cut to 2026.
One person. One Claude subscription. A day or two of directed effort.
The result: a live configurable prediction engine that uses peer-reviewed statistical models, pulls live match data automatically, runs tens of thousands of simulated tournaments in the background, and sits online — updating itself — without any ongoing intervention.
No team.
No server.
No data engineering.
No specialist required.
The gap between those two things is twelve years. Well within most of our living memories. And it is one of the clearest illustrations I’ve seen of how completely the tooling around data and AI has shifted. What required a team and weeks in 2014 is now an afternoon for one person with the right AI.
That’s not a comment about effort or intelligence. The Dell teams who ran those 2014 models were talented people doing serious work. It’s a comment about leverage — how much the tools themselves have changed what’s possible, and how quickly.
Back to present day
Every four years, the same thing happens regardless: a pundit on TV tells you Spain are favourites, the betting site gives you odds you don’t know how to interpret, and your group chat argues about whether England will bottle it.
Everyone has opinions.
Nobody has a model.
Now there’s one available — and you can adjust its assumptions to match yours.
Live at: buildthisnextonline.github.io/FIFA-2026-WC
What the tracker does
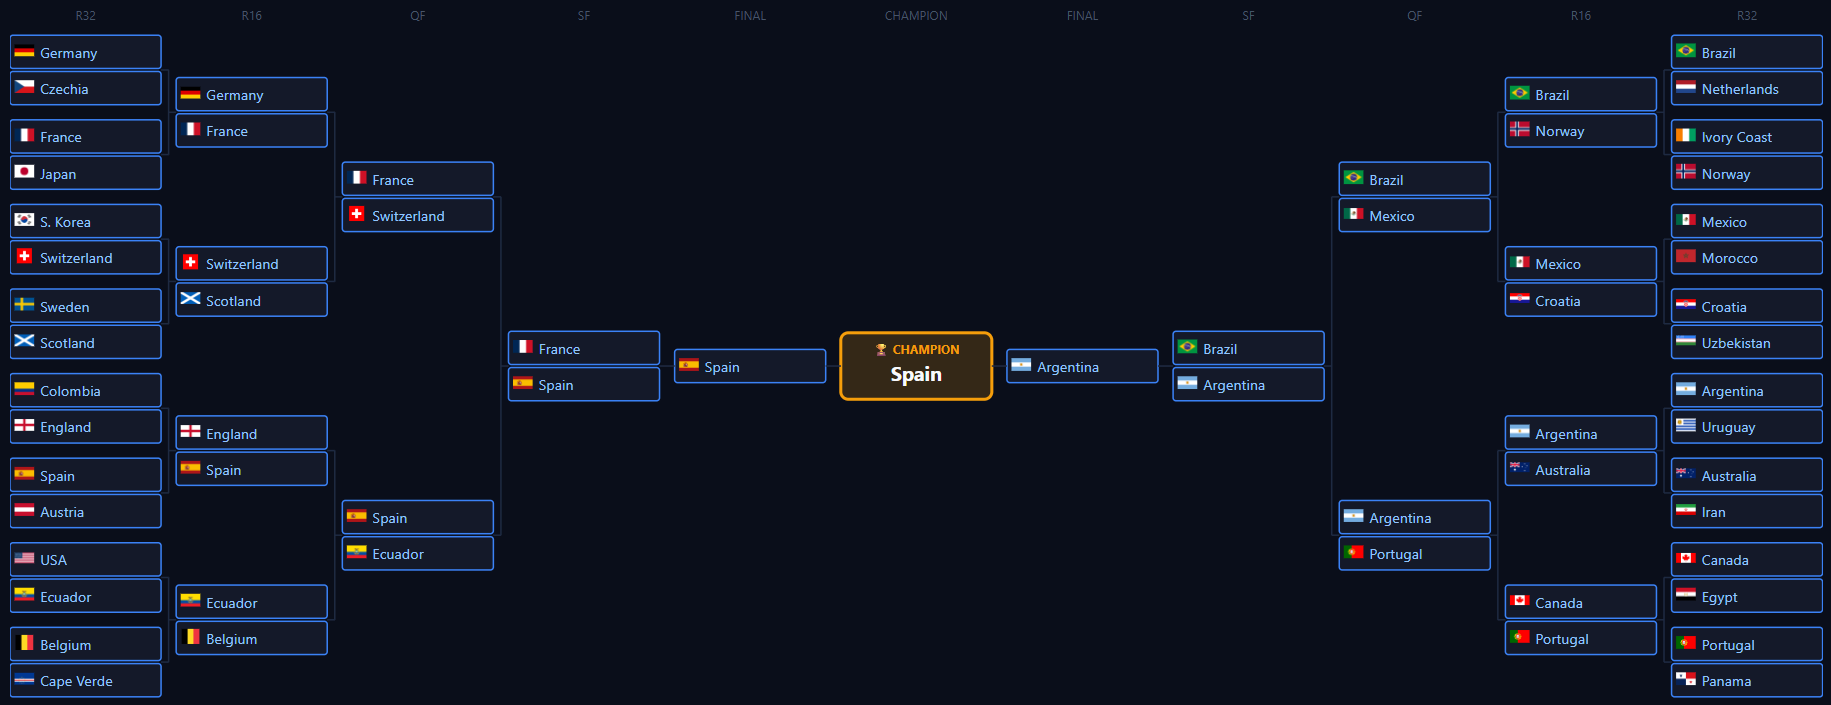
The FIFA World Cup 2026 Probability Tracker does two things simultaneously.
Current mode shows you the state of the tournament right now — actual results, group standings, who’s qualified and who’s out. Updated from live match data as games are played.
Prediction mode shows you what the model thinks happens next — win probabilities for every remaining match, expected scores, who finishes where in each group, and a full knockout bracket all the way to the champion.
Both views sit in the same interface.
One click switches between them.
The tracker covers all 104 matches across 48 teams, grouped A through L. As matches are played, the prediction window shrinks — by the time you reach the Final, there’s only one match left to call.
Why this is more useful than odds
Betting odds tell you what the market thinks. That’s useful — but it’s not the same as a model with a theory.
The tracker is built on a football statistics technique called Poisson modelling — essentially, a mathematical way of estimating how many goals each team is likely to score, based on how strong they are relative to each other.
It’s seeded from Elo ratings (the same system used in chess) which give every national team a baseline strength score. From there, the model applies real-world adjustments that matter in a World Cup:
Home ground: Mexico, USA, and Canada get a boost on home soil
Rest between matches: teams with more recovery days tend to score more
Extra time fatigue: if a team just played 120 minutes, the next game is harder
You can change all of those assumptions. That’s the point.
The five sliders that make this yours
The parameters panel in the header isn’t decoration. It’s where you put in your own read on the tournament.
Home advantage — How much does playing in North America boost the host nations? The default is +20%. Set it to zero if you think home crowds don’t matter. Crank it up if you think they’ll be decisive.
Draw correction — The model naturally predicts slightly too few draws. This slider corrects for that. The default adds a modest nudge toward 1-1 and 0-0 results.
Rest advantage — Teams with more recovery days perform better. Default is +5% per significant rest gap.
Extra time fatigue — Did a team just play 120 gruelling minutes? The default applies a −10% penalty to their next match.
Simulations — The model runs thousands of complete simulated tournaments to estimate probabilities. 1,000 runs is fast and rough. 50,000 is slow and precise. The default is 10,000 — a good balance.
Change any slider. Hit Apply. Every fixture, every table, the full bracket — everything updates to your assumptions in seconds.
Two views worth spending time in
Stage Probabilities strips away all the bracket narrative and shows you the raw numbers. All 48 teams, side by side, with their probability of reaching each round — Qualify, Round of 16, Quarter-final, Semi-final, Final, Champion. No punditry. No storylines. Just: here is what the model thinks, for every team.
Tournament Draw is the bracket. It shows you the single most-likely path — actual results where matches have been played, model predictions for everything still to come. You can see who the model has lifting the trophy, and who they’d have beaten to get there.
There’s also a fan mode — because not everyone wants to trust the model.
Select any of the 48 teams from the “Root for” dropdown above the Tournament Draw. That team’s matches light up in orange through the bracket. Click any of their matches to lock in a win — overriding the model’s prediction. The bracket rebuilds forward from that result: if you’ve decided Netherlands are beating Spain in the Final, the whole path recalculates to show what that would look like. Click again to release any lock and restore the model’s pick.
Locks are sequential. You can only lock a Semi-final if you’ve locked the Quarter-final that got your team there. And if you go back and unlock that Quarter-final, the Semi-final and Final locks disappear automatically — because without the QF win, your team was never in those matches to begin with.
Stage Probabilities stays untouched. It still shows you the model’s honest assessment of every team’s actual chances. Fan mode is purely a Tournament Draw feature — a “what would have to happen” view, not a revision of the underlying numbers.
These two views will sometimes show different teams in the quarter-finals. That’s not a bug.
Stage Probabilities runs 10,000 simulated tournaments where groups can turn out differently in each run. A team can have a 25% QF chance overall because they reach the quarters across many different simulated paths — sometimes with an easy draw, sometimes not.
Tournament Draw shows one specific predicted path. It anchors on the most likely group outcomes and predicts match by match from there.
Both are correct. They answer different questions. The tracker says so, right there on the page.
It gets more interesting as the tournament goes on
This is a live tracker, not a pre-tournament prediction frozen in amber.
When USA beat Paraguay 4-1, that result locks in. The model doesn’t second-guess it. It takes the actual scoreline, updates the group table, and predicts forward from there.
By the quarter-finals, half the bracket is real. By the semis, almost everything is anchored in actual results. The model is only filling in the gaps.
This is where the tracker is most useful — not at the very start when everything is hypothetical, but mid-tournament, when you have real results to anchor to and real stakes on every remaining match.
Where things are headed
Twelve years ago, building this took a team, weeks, and significant expertise.
Today it took one person and a couple of days.
That's not an edge case.
That's the new baseline.
And it's only getting wider.
The question is what you do with it.
Build This Next.
Build This Next is about tools that fill real gaps — built fast, built properly, and put in front of people who need them.
Want to know how it was actually built? The full technical story — model, simulator, and the bracket problem that didn’t have a clean answer — is on Promptcraft: Building a Live FIFA 2026 World Cup Probability Engine with Claude.
I write about how products can be better — fixing what’s broken and imagining what’s missing.
If this made you notice something broken or missing, you can subscribe to Build This Next to receive future essays directly.
Every subscription is a vote for building better products.
And if this sparked an idea, take a few seconds to share it — it might help someone else build or see products differently.